

Centralizing SQL Server Agent job monitoring can become highly challenging when jobs are distributed across multiple database servers. While SQL Server provides built-in history tables within the msdb database, reviewing job executions typically requires connecting to each database server individually. This fragmented approach makes it difficult for operations teams to gain a unified view of job health or analyze execution trends across various environments. By integrating SQL Server Integration Services (SSIS) with Splunk, you can automatically collect job execution metadata from across your SQL Server landscape and stream it into a centralized platform for real-time monitoring and analysis.
In this blog post, we will demonstrate how to retrieve SQL Server Agent job execution metadata from an SQL Server instance and effectively transmit that information to Splunk using its HTTP Event Collector (HEC) API. The job metadata is extracted using the Premium SQL Server Source component (part of our SSIS Integration Toolkit offering), and the load is managed by our REST Destination component with Splunk selected as the destination service. We have included a sample package (link here) that you can download to follow along with this guide.
Control Flow Design Overview
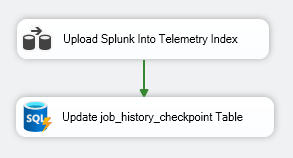
Within your SSIS package, the architecture consists of two overarching processes. The first performs a query on the Microsoft SQL Server system tables and loads the data into Splunk. Afterward, an update action is executed on a control table to capture the latest checkpoint, ensuring only incremental values are fetched during subsequent package executions.
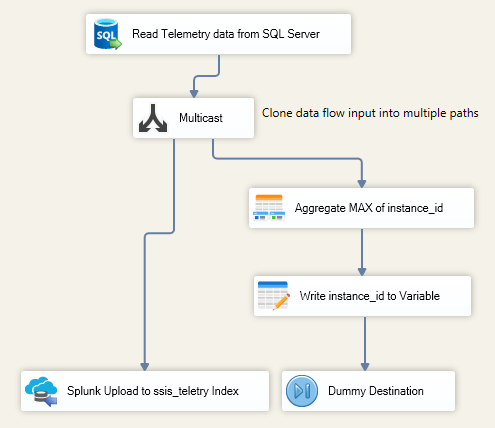
When looking closely at the data flow task, the design may look complex at first glance, but it can be broken down into three straightforward steps. First, we use the Premium SQL Server Source component to execute a custom query and return our telemetry data. We then multicast the data into two separate data paths; this allows us to perform an aggregation in parallel and store the maximum synced value into a user variable. While the Dummy Destination is not strictly required, it is used to complete all paths of your Data Flow to ensure consistent runtime completion. The left side of the data flow handles formatting and writing the event payloads to Splunk.
Taking a closer look at the Premium SQL Server Source component, configuring the Data Source to use a Custom Command allows us to run specialized queries directly against system tables.
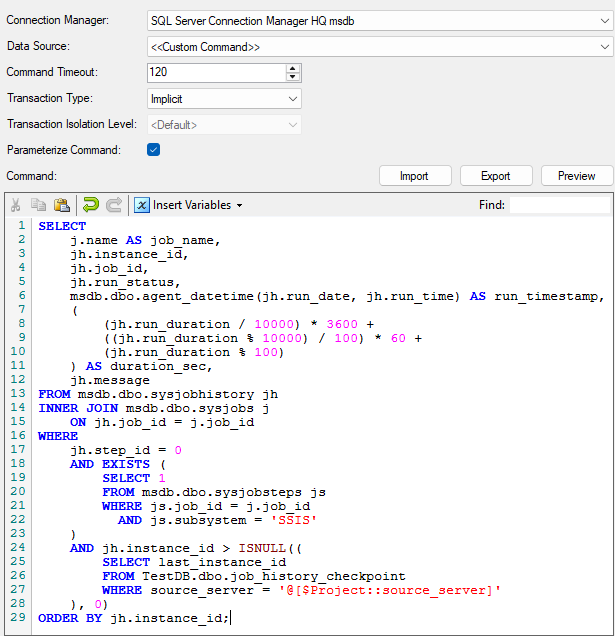
Our query targets a few main system tables while performing joins to enrich the metadata:
-
sysjobhistory: This table stores the execution history of SQL Server Agent jobs. We retrieve data from several critical columns:
instance_id: A unique identifier for every job execution. This system value auto-increments by one, making it ideal for managing incremental data loads. System jobs are also included here.job_id: The unique GUID of the job. While helpful behind the scenes, it is not easily human-readable, so it is used in a join to pull the friendly job name.run_status: An integer representing the outcome status of the job execution (e.g., Success, Failure, Cancelled).run_duration: How long the job took to execute, natively stored in anHHMMSSinteger format.run_date/run_time: Natively, these are separated into two awkward integer fields rather than a unified timestamp.message: Provides descriptive output or error messages detailing the outcome of the scheduled job step.
- sysjobs: This table stores job-level metadata. The primary field we require from this table is the readable
namefield. - sysjobsteps: This table stores the individual steps within each job. Because we are looking specifically for SSIS-based executions in this scenario, we can inspect the
subsystemfield to ensure only jobs containing 'SSIS' steps are captured. -
job_history_checkpoint: This is a custom control table created in the environment to track the latest job
instance_idsynced from each database server.source_server: The server name acting as the primary key to easily track monitoring checkpoints across a multi-server environment.last_instance_id: Represents the highest processedinstance_id, which is updated at the end of the package run using our aggregated maximum value.
Additional Query Logic and Functions:
- msdb.dbo.agent_datetime(run_date, run_time): This built-in function converts the awkward integer formats of
run_date(YYYYMMDD) andrun_time(HHMMSS) into a unifiedrun_timestampfield. Because ISO 8601 is the preferred timestamp format for Splunk ingestion, this function handles that preparation seamlessly. - Lines 7 to 11: This math formula converts the standard
HHMMSSduration integer into total seconds. Sending the runtime duration as an absolute number of seconds to Splunk significantly improves calculation clarity when creating dashboards or alerts. - Line 17 (jh.step_id = 0): This filter ensures we only pull job-level summary results, as any
step_idgreater than 0 indicates individual inner step metrics. - Lines 18 to 22: This utilizes an
EXISTSclause againstsysjobstepsto ensure the parent job contains at least one step executing an SSIS subsystem. This filters out non-essential system or maintenance tasks (such as pureTSQL,CmdExec, orPowerShelljobs) that might clutter your monitoring dashboards. - Lines 24 to 28: This subquery references our control table to pull the
last_instance_idmatching our dynamic Project Parameter (@[$Project::source_server]). We filter the source records to ensure we only load data where theinstance_idis greater than our last recorded checkpoint. TheISNULLfunction defaults this to 0 if a server is being monitored for the first time.
The following text block contains the exact script shown in the custom command screenshot above:
SELECT
    j.name AS job_name,
    jh.instance_id,
    jh.job_id,
    jh.run_status,
    msdb.dbo.agent_datetime(jh.run_date, jh.run_time) AS run_timestamp,
    (
        (jh.run_duration / 10000) * 3600 +
        ((jh.run_duration % 10000) / 100) * 60 +
        (jh.run_duration % 100)
    ) AS duration_sec,
    jh.message
FROM msdb.dbo.sysjobhistory jh
INNER JOIN msdb.dbo.sysjobs j
    ON jh.job_id = j.job_id
WHERE
    jh.step_id = 0
    AND EXISTS (
        SELECT 1
        FROM msdb.dbo.sysjobsteps js
        WHERE js.job_id = j.job_id
          AND js.subsystem = 'SSIS'
    )
    AND jh.instance_id > ISNULL((
        SELECT last_instance_id
        FROM TestDB.dbo.job_history_checkpoint
        WHERE source_server = '@[$Project::source_server]'
    ), 0)
ORDER BY jh.instance_id;
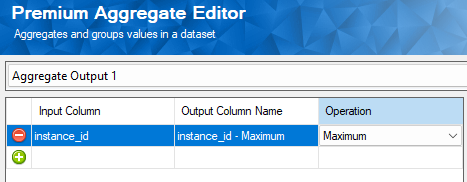
In one of the multicast output paths, we isolate the largest instance_id value from the current batch of records. This is easily achieved by routing rows through our Premium Aggregate component and applying the Maximum operation on the column.
Downstream, we map this value using our Premium Derived Column component, configuring it to write directly to an SSIS user variable. This persists the maximum ID value so that it can be passed over to the subsequent control flow task once the data flow completes.

Configuring the Splunk Destination
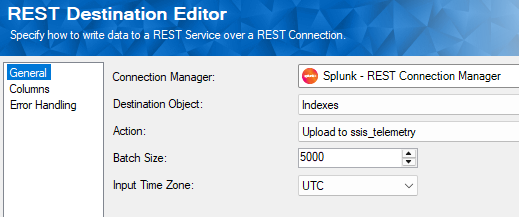
The primary path of the data flow streams the prepared telemetry records directly into Splunk. Our REST Destination component is configured to interface with Splunk's HTTP Event Collector (HEC) endpoint, which is the optimized ingestion path for streaming application event data. SSIS effectively acts as the data producer - packaging each row of SQL Server Agent metadata into a structured JSON event payload before securely transmitting it over HTTPS. Inside the destination component, we target Indexes and select the appropriate index action targeting our specific repository (in this example, we created an index named ssis_telemetry).
On the Columns page, clicking the Manage Index Fields button allows you to quickly populate the destination schema mapping based on upstream columns. You can manually add, edit, or remove fields here. Because Splunk indexes accept dynamic schemas, you simply need to map your data into clean, lowercase field names suitable for downstream searching.
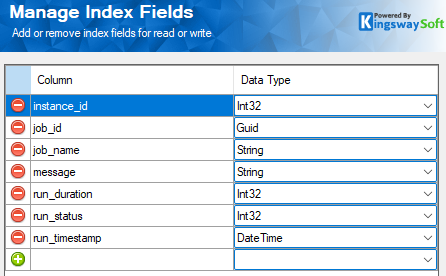
As illustrated in the syntax snippet below, each event payload sent to the HEC contains atomic details regarding a single SQL Server Agent job execution. These structured fields make it simple to filter, aggregate, and report on job health once the dataset populates Splunk.
{
  "instance_id": 12096,
  "job_id": "7b94076b-15a0-4b6e-a877-5a1201fcd5aa",
  "job_name": "HSSync",
  "message": "The job succeeded....",
  "run_duration": 45,
  "run_status": 1,
  "run_timestamp": "2026-03-20T09:10:00-04:00"
}
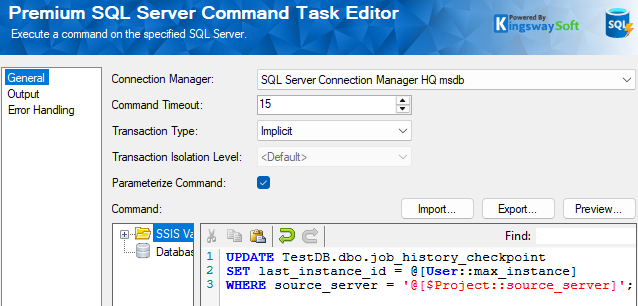
Finally, once the Data Flow completes successfully, the concluding step in the Control Flow uses an Execute SQL task to update our checkpoint table with the max_instance variable value. The source_server parameter is supplied dynamically via an SSIS Project Parameter, ensuring the package remains completely reusable across multiple server environments. This architecture scales easily: as you add more SQL Servers to your ecosystem, the job_history_checkpoint table maintains an isolated track of each distinct environment. You can schedule and run this single package loop as many times as needed by simply altering the environment variable input.
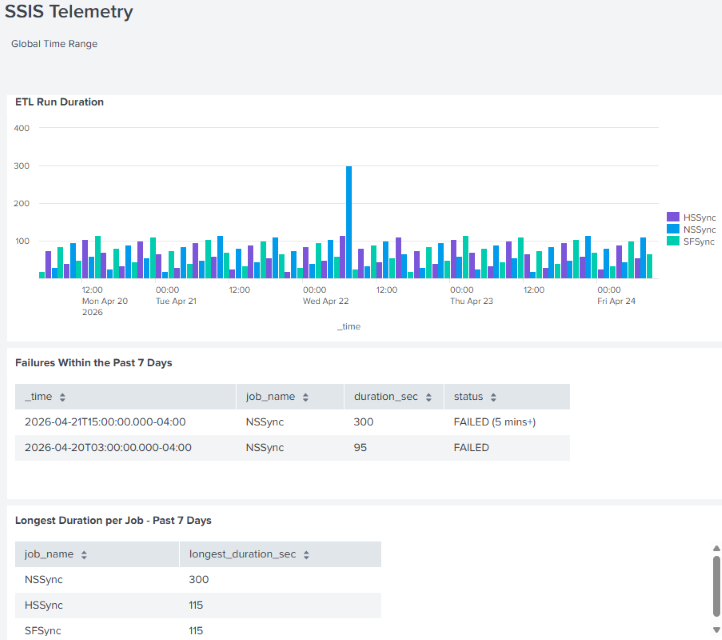
Once this orchestration is scheduled and your telemetry begins piping into Splunk, Operations Teams can build rich, real-time dashboards to visualize execution metrics and automate alerting. For instance, a dedicated monitoring dashboard can graph job run durations over time, surface unexpected failures in an interactive grid, or isolate long-running anomalies before they impact business lines. Consolidating this data into Splunk eliminates the tedious overhead of manually logging into separate instances to investigate job history. Instead, infrastructure health is exposed transparently inside a central glass pane.
Conclusion
Monitoring distributed SQL Server Agent jobs across a massive database footprint can quickly lead to visibility gaps without centralized telemetry tracking. By combining the Premium SQL Server Source component to pull incremental job metadata with our flexible REST-based destination components to stream events into Splunk’s HEC API, you can easily establish robust operational visibility. This solution enables engineering teams to identify failures faster, spot efficiency trends over time, and protect production environments. We hope this guide helps streamline your enterprise SSIS integration journeys!