For example, consider a Survey API that returns data in the following format:
{
  "responses": [
    {
      "id": "R1",
      "submittedOn": "2025-10-01T14:25:00Z",
      "respondent": {
        "id": "S1",
        "name": "John Smith"
      },
      "questions": [
        { "id": "Q1", "type": "satisfaction", "answer": "Very satisfied" },
        { "id": "Q2", "type": "recommendation", "answer": "Yes" },
        { "id": "Q3", "type": "comments", "answer": "Excellent service!" }
      ]
    },
    {
      "id": "R2",
      "submittedOn": "2025-10-02T11:05:00Z",
      "respondent": {
        "id": "S2",
        "name": "Jane Doe"
      },
      "questions": [
        { "id": "Q1", "type": "satisfaction", "answer": "Neutral" },
        { "id": "Q2", "type": "recommendation", "answer": "Maybe" },
        { "id": "Q3", "type": "comments", "answer": "Could be faster." }
      ]
    },
    {
      "id": "R3",
      "submittedOn": "2025-10-03T09:10:00Z",
      "respondent": {
        "id": "S3",
        "name": "Carlos Mendes"
      },
      "questions": [
        { "id": "Q1", "type": "satisfaction", "answer": "Very satisfied" },
        { "id": "Q2", "type": "recommendation", "answer": "Yes" },
        { "id": "Q3", "type": "comments", "answer": "Great experience!" }
      ]
    }
  ]
}
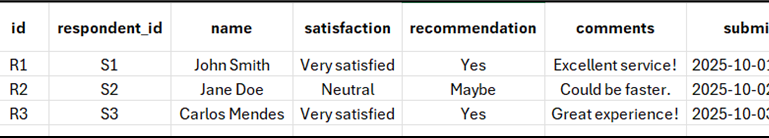
In this structure, each client object contains metadata (like id, name, and submittedOn) and an array of survey questions. To prepare this data for analysis, we need to flatten it into a tabular form where each question’s answer becomes a separate column, resulting in a single row per respondent.
The desired output should look like this:
Why Not Just Use a Simple Merge Join?
At first glance, it might seem straightforward to flatten the arrays and join them back to the parent using a standard Merge Join. However, because each parent has multiple related survey answers, this approach creates a one-to-many relationship. The result is multiple rows per parent record, rather than the single, wide record required for analysis.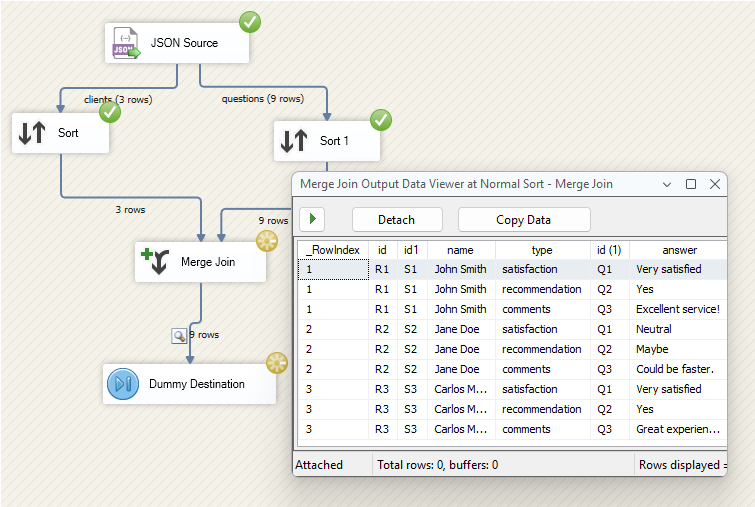
This duplication makes it difficult to produce a unique record per client. To address this, some may turn to complex Lookup patterns.
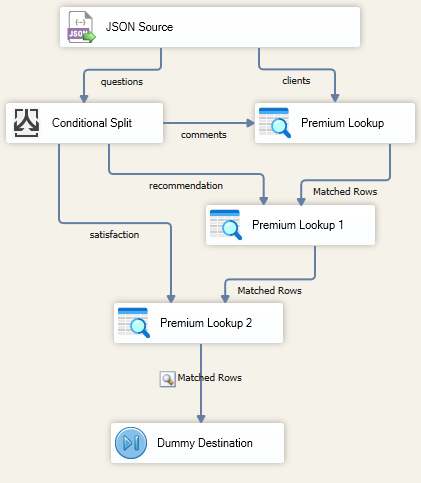
Traditional Approach: Using Multiple Outputs and Premium Lookups
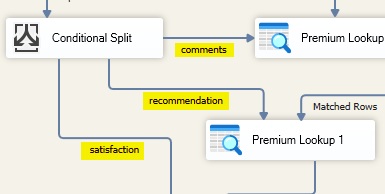
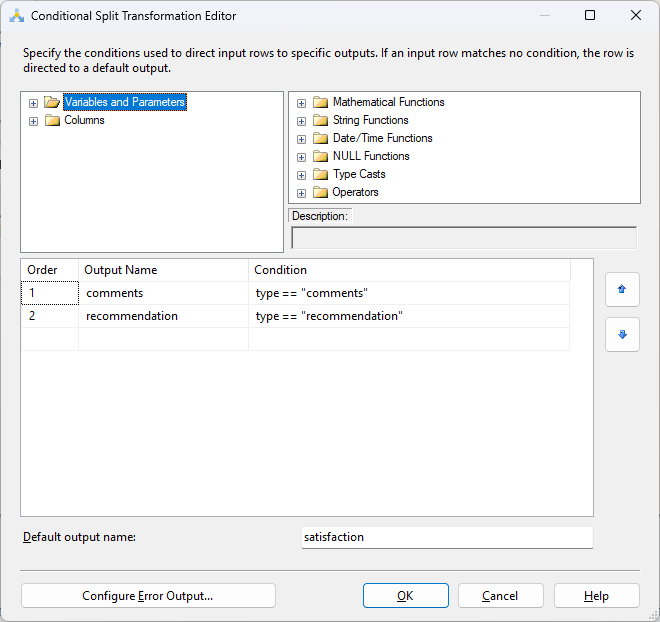
In traditional ETL design, flattening this specific type of nested JSON requires splitting the child data into separate streams based on the question type and then re-joining them.This design usually involves a Conditional Split transformation to separate the question output into three streams (e.g., “comments”, “recommendations”, and “satisfaction”).
You would then configure the split conditions based on the specific type or ID of the question:
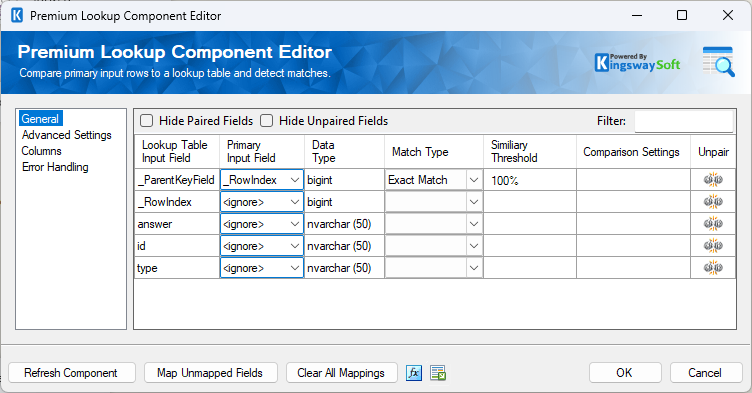
Once the streams are split, you must reconnect them to the parent data. This requires multiple Premium Lookup components to align the child data back with the corresponding parent entities.
For each Premium Lookup, you must explicitly map the parent keys to ensure the answers align with the correct client record.
Then, you need to configure the output columns. You may manually rename the output alias for every lookup (for example, renaming answer to comments) to ensure they map correctly in the destination.
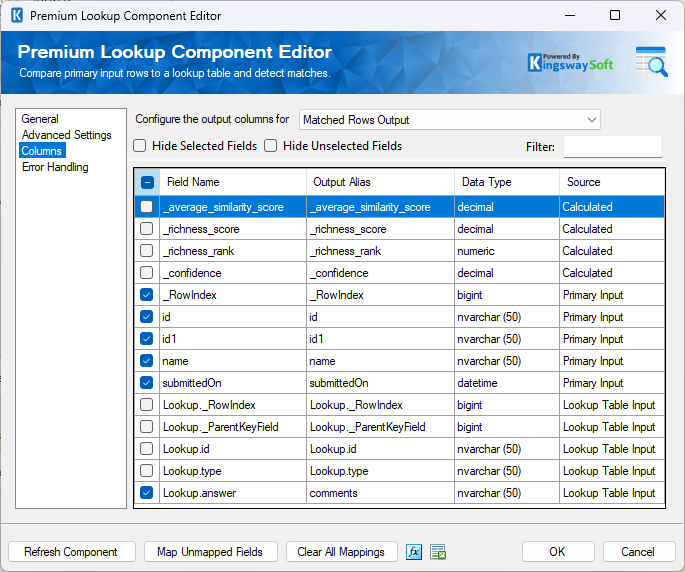
You would then repeat this process for the next stream, configuring a separate lookup and renaming that column to recommendations.
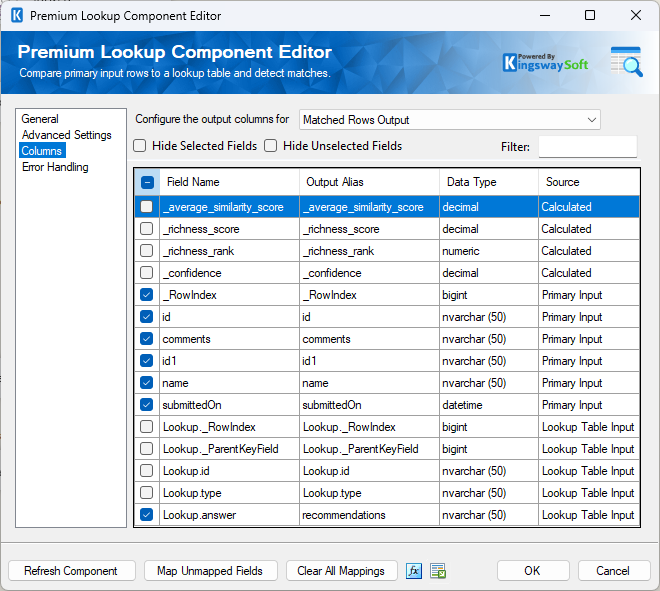
While this method works, the final output requires significant effort to build. In addition, this approach scales poorly. Each additional question type requires another condition in the Conditional Split and an entirely new Premium Lookup component. As the survey grows, the data flow becomes brittle and difficult to maintain.
A Simpler Way: Using Key Value Pivot in JSON Source
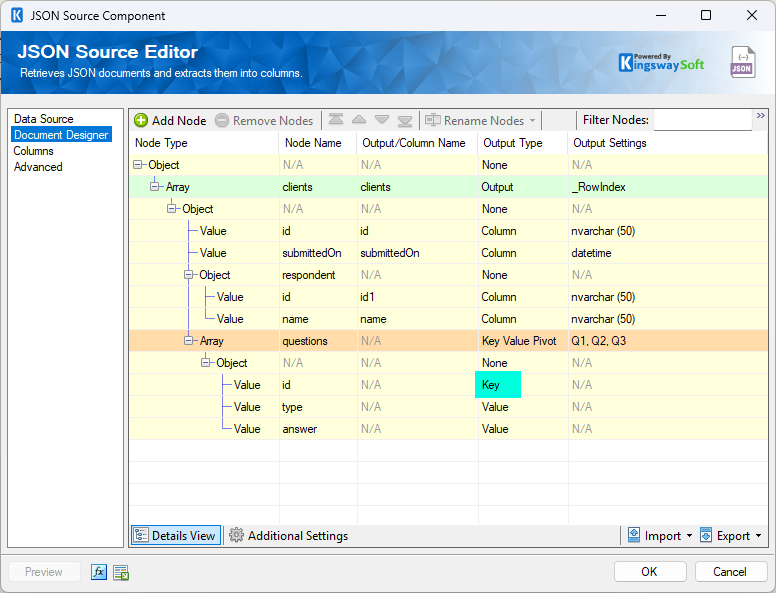
KingswaySoft’s JSON Source component offers a much cleaner solution through the Key Value Pivot feature within the Document Designer. By pivoting key/value pairs directly within the source, you can flatten nested structures without a single Lookup or Conditional Split. This reduces the component count, improves performance, and makes the package significantly easier to read.Here is how to configure it.
Step 1: Configure the Child Array
Navigate to the Document Designer page in your JSON Source component. Locate the questions array node. Set the Output Type to Key Value Pivot. Select the identifier you would like to use as the Key (in this case, id).
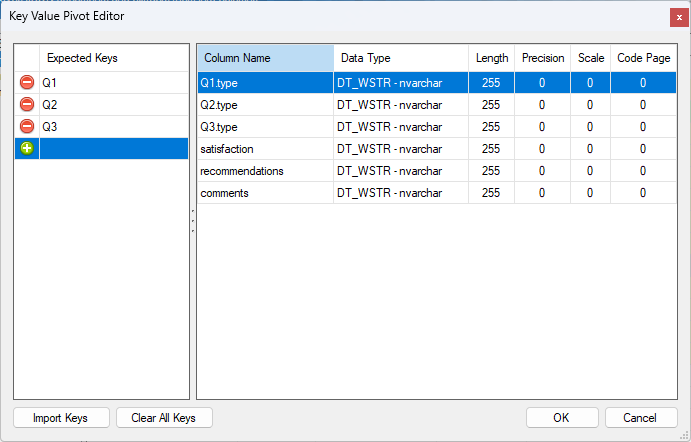
Step 2: Define Expected Keys
Next, double-click the Output Settings cell next to Key Value Pivot to open the Key Value Pivot Editor.
Under Expected Keys, enter the static values you expect from the API (such as Q1, Q2, Q3). For each key, you can assign a friendly Column Name, such as satisfaction, recommendations, or comments.
Note: You can ignore the type values in the mapping if they are not required for the final output.
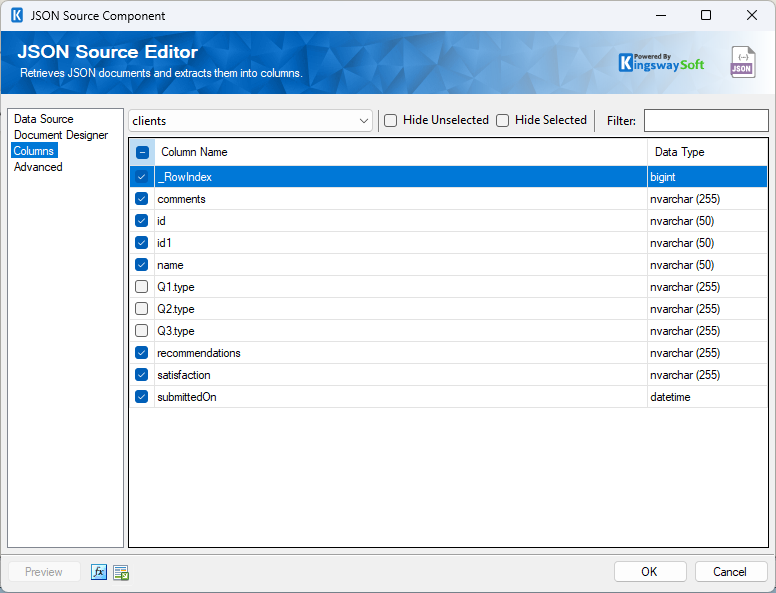
Step 3: Finalize Columns
Once configured, head to the Columns page. You can now uncheck the generic type fields since we have mapped the specific values to their own named columns.
Conclusion
Once configured, the JSON Source automatically produces a flattened dataset with each question answer as its own column, all within a single component.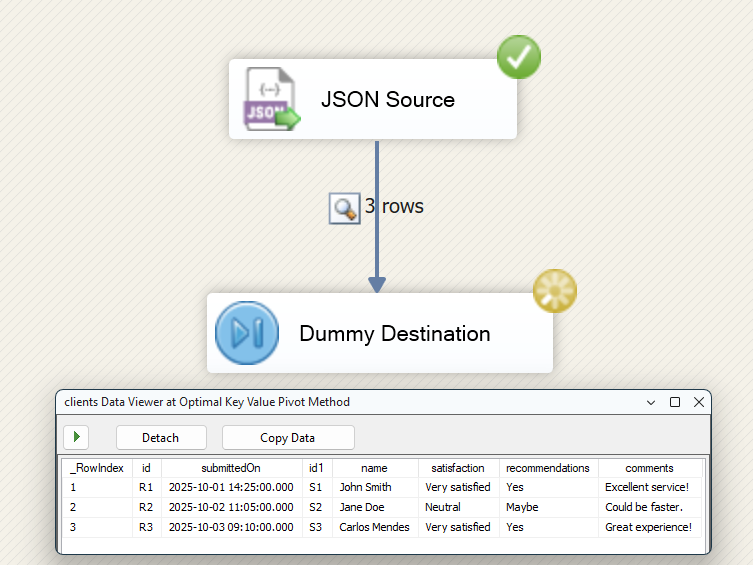
The Key Value Pivot feature transforms what used to be a complex, multi-component design pattern into a simple configuration task. By pivoting data at the source, you improve readability and streamline the process of working with complex, nested API outputs.